
The Connectivity Lab team at Facebook is working on communication technologies aimed at connecting people in rural areas who currently do not have access to the internet. Earlier this year we announced that we are working on high-resolution population maps in order to learn how people are aggregated in various parts of the world, which will help us design the best communication technologies for each region.
Today, we started sharing the population datasets publicly because we believe this data will be useful in many other ways, including for things like humanitarian aid planning, disaster response, and infrastructure planning. In this post, we’ll explain the technology and the process behind arriving at these datasets.
The dataset
Our population datasets are a joint effort between Facebook, Columbia University, and the World Bank. At Facebook, we use state-of-the-art computer vision techniques to identify buildings from commercially available satellite images — the same type of imagery made available via publicly accessible mapping services. Using this building information, Columbia uses census data to generate population estimates, validates the result against other, more coarse-grained datasets and then the World Bank Living Standards Measurement Study (LSMS) program validates the final dataset against anonymized “ground-truth” household surveys.
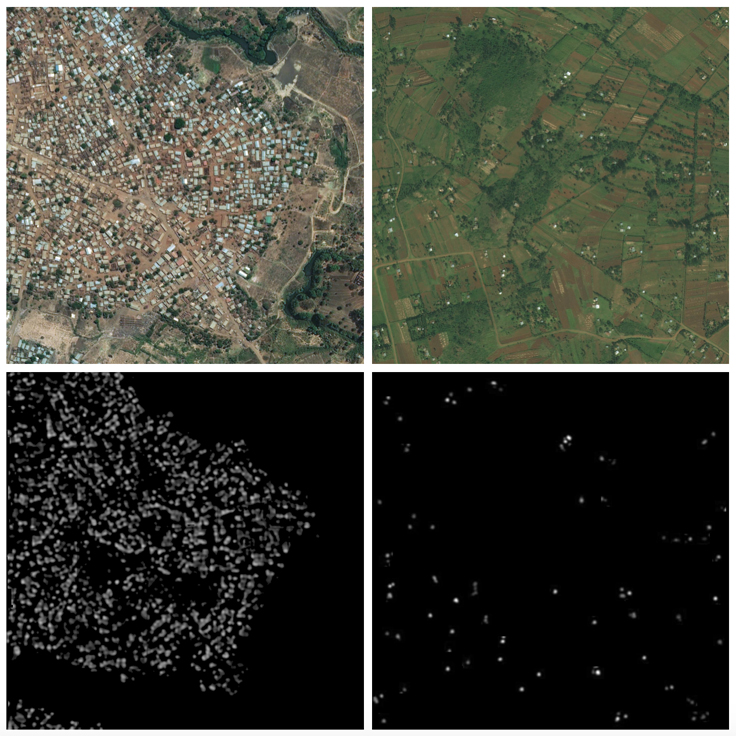
We used state-of-the-art convolutional neural networks to develop a model that has the accuracy to identify individual buildings and simultaneously works on satellite images across the globe. In order to achieve these contradicting requirements, we had to make tradeoffs in the performance of the model. There has been a lot of work recently on neural networks that can recognize individual buildings with very high accuracy, but these models are finely tuned on the local characteristics of the region where they are trained. We found that these models do not perform well at a global scale with realistic amounts of training data. Therefore, we developed a model that is trained only on binary labeled data — if an image does or does not contain a building — which allows for fast acquisition of the training data. Despite the challenges with our training data, our model is able to detect the shape and sizes of buildings, which enables us to improve the accuracy of our population estimates. In the image below (figure 3) you see two examples of the performance of the model in Malawi (left) and Kenya (right). Clearly, our model identifies individual buildings and enables us to quantify the distribution of population even in very sparsely populated areas. Our collaborators at the World Bank validated the Malawi dataset and found that on average we miss only about 6% of the houses that are part of their 2011 household survey data (LINK).
Dataset analysis
From a first analysis of our dataset we extract how people are aggregated near urbanized areas that have more than 10,000 people. We perform a clustering algorithm to automatically identify urbanized areas, and for the remaining population we determine how close they are to the nearest city. The cumulative distribution of the distance of population to the nearest city for 23 countries (covering about one third of the world population) is shown in figure 2 below.
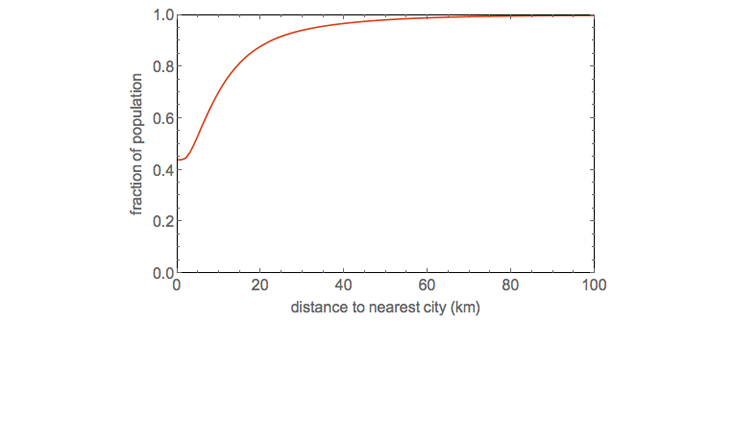
From this preliminary analysis, we’ve determined that slightly less than 50% of the population lives in cities. However, 99% of the population lives within 63 km of the nearest city. Hence, if we are able to develop communication technologies that can bridge 63 km with sufficiently high data rates, we should be able to connect 99% of the population in these 23 countries.
This is a challenging task, since the highest-throughput wireless communication methods require a line of sight between the transmitter and the receiver. This requirement can be met by using an aerial platform such as Aquila or satellites. We are currently working on a variety of communications technologies to solve these problems, and recently shared an update on reaching record-breaking data rates with our millimeter-wave technology. Our new dataset provides us with information on population distribution and location characteristics that will help us design these technologies more accurately. We would love to hear ideas (preferably also in an open manner) on how to bridge this distance in an economically viable fashion for line of sight and non-line of sight use cases, and we hope that by sharing these datasets we will stimulate further research.
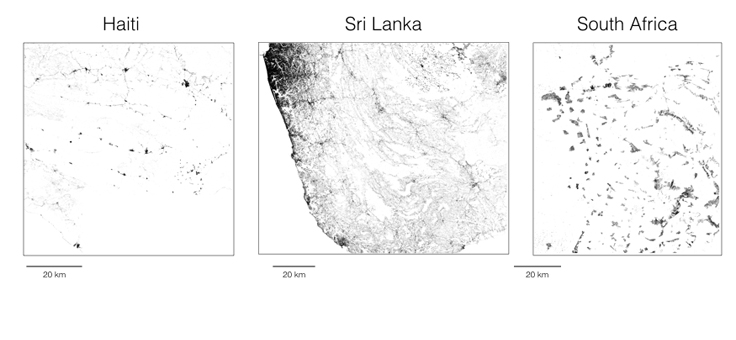
To start, we’ve shared data sets for Malawi, South Africa, Ghana, Haiti, and Sri Lanka, and they can be found on the website of CIESIN at Columbia University. We will keep adding more countries over the coming months.
Developing communication technologies to reach the rest of the world is not a challenge we will solve alone. We want this data to be a new source of information to empower other organizations to achieve their missions. For example, The Red Cross is already planning to use the population maps to help combat malaria in Malawi, and to target humanitarian aid after natural disasters. By sharing our data and the problems we are working on publicly we hope to stimulate an open approach to solving local and global challenges.
This work was done in close collaboration with the Core Data Science team at Facebook.


")


