
Large-scale graph processing is one of many important parts of the Data Infrastructure backend services at Facebook. The need to analyze graphs arises naturally in a wide variety of use cases, including page and group recommendations [2], infrastructure optimization through intelligent data placement [3], graph compression [4], and others. The Facebook social graph alone has 1.71 billion vertices with hundreds of billions of edges. Augmenting this graph with more entities, such as the pages that people like, may result in graphs with over 1 trillion edges.
At Facebook, we have built a graph analytics platform based on Apache Giraph, which we described in a previous blog post [7] and in our VLDB ’15 paper [1]. Since its inception, Giraph has continued to evolve, allowing us to handle Facebook-scale production workloads [1] but also making it easier for users to program [6]. In the meantime, a number of other graph processing engines emerged. For instance, the Spark framework, which has gained adoption as a platform for general data processing, offers a graph-oriented programming model and execution engine as well — GraphX [5].
As our goal is to serve internal workloads in the best possible way, we decided to do a quantitative and qualitative comparison between Giraph and GraphX, since at Facebook we already have a Spark cluster supporting production workloads [11]. Specifically, we are interested in measuring the relative performance and ability of the two systems to handle large graphs. While performance is our main focus, we are also interested in usability and how easy it is to develop applications in the two systems.
Τhe key takeaways from our study are the following:
- Performance & scalability
- Giraph can currently process at least 50x larger graphs than GraphX.
- Even on smaller graphs, Giraph performs better. Apart from this, GraphX exhibits large performance variance.
- Giraph is more memory-efficient. The total memory required to run jobs on a fixed graph size is a few times lower for Giraph than for GraphX.
- As a consequence, Giraph requires fewer machine hours to process the same graph, making it more efficient overall.
- Usability & application development
- GraphX allows graphs to be read from Hive using an SQL-like query, allowing arbitrary column transformations. Giraph requires extra programming effort for such preprocessing tasks.
- Interacting with data in Spark (e.g., checking the output of a job) is convenient, though mostly when experimenting with small graphs.
- Using Scala from the shell environment can be convenient for testing simple GraphX applications, though an IDE is still indispensable when applications become more complex.
Overall, we found that Giraph was better able to handle production-scale workloads, while GraphX offered a number of features that enabled easier development. In the rest of this post, we describe in more detail our methodology and findings.
Methodology
We wanted to evaluate how the two systems perform with different applications, data sets, and cluster setups, and to perform the comparison as fairly as possible.
Different algorithms may have different computation and communication patterns that may exercise various parts of a system in different ways. For instance, message-heavy algorithms typically require more memory and are therefore more sensitive to how efficient memory management is. Here, we use three different algorithms: PageRank, Connected Components, and Triangle Counting. PageRank exhibits a typical computation and communication pattern: The amount of computation and communication is constant across iterations, and they are both O(|E|), where E is the set of the graph edges. Connected Components is similar, though the amount of computation and communication decreases across iterations. These two algorithms are also used in the GraphX paper [5], so they set for a good reference. Triangle Counting, on the other hand, is more message-heavy, as the amount of communication is sum(d_i^2), where d_i is the degree of vertex v_i. All these algorithms exercise the basic graph computation concepts: storing the graph and sending messages (shuffling data). They all have straightforward implementations in both Giraph and GraphX, allowing us to factor out artifacts of differences in the implementation.
We also used the same data types to represent the graph metadata in both systems, as this affects memory usage. For instance, in the unweighted PageRank implementation in Giraph, we used longs for vertex IDs, nulls for edge values, and doubles for messages and the vertex value. Similarly, in GraphX we created a graph with long vertex IDs and no values, while the PageRank implementation uses doubles to store the PageRank of each vertex.
Additionally, we wanted to measure how different types of graphs may affect the relative performance of the two systems . For instance, certain type of graphs (such as the Twitter graph) have supernodes, vertices with highly skewed degree, while the Facebook friendship graph does not exhibit this property. The presence of such graph artifacts may, for instance, cause more memory pressure on certain machines or skew the compute load. Depending on the design of each system, these artifacts may affect their performance in different ways.
The cluster and system configuration may also affect relative behavior. For instance, for memory-bound applications, we have found that even if we allocate the same total amount of memory, the number of workers in a cluster may affect performance. This is noteworthy, as different cluster setups may implement different resource allocation policies. On the system side, configuration parameters such as the number of compute threads vs. communication threads, number of graph partitions, or even the choice of the Java Garbage Collection mechanism may also affect performance. Given these variables, we fine-tuned each system to ensure maximum performance. We will be describing the details in each of the experiments below.
Experiment setup
We used Spark-1.6.1 and Giraph-1.2.0 for all our experiments, and Java 8u60. Spark runs jobs on cluster by starting “executors” on cluster machines. Executors are worker processes, each running in a separate JVM. Within an executor, GraphX parallelizes processing by running multiple tasks, each within its own thread. Giraph has a similar architecture with slightly different nomenclature. For consistency, we use the term “workers” to refer to the worker processes (i.e., Spark executors), and “threads” to refer to processing threads for each worker (i.e., Spark tasks).
The basic parameters in both systems are the number of workers, the number of processing threads, and the total memory allocated. Even though both systems can run multiple workers on a single physical machine, we found that it is more efficient when we start only one worker process per machine and allocate all the available memory to it. In the following experiments, the number of workers is also the number of physical machines used for each job. We allocated 80 GB of RAM to each worker.
Both systems divide graphs into partitions, and allow threads to process partitions in parallel. In Giraph, the number of various threads is calculated automatically based on the number of cores allocated to workers, and the number of partitions is then set in a way that allows for good utilization of these threads. In GraphX, after trying different numbers of partitions, we found that 8 partitions per worker is optimal, even though the machines we used have 20 cores. Both systems allow different graph partitioning methods. In GraphX, we used the EdgePartition2D strategy, as it was 2.5x faster than the default strategy. Giraph does not support such an optimization, so we simply used hash partitioning on the vertex IDs.
The choice of GC mechanism also mattered. Both systems performed better with Parallel GC as the JVM garbage collection mechanism. On top of this, GraphX exhibited larger performance variance when using CMS or G1 as the GC mechanism. In all experiments below, we used Parallel GC.
We used the following configuration for Spark:
spark.dynamicAllocation.initialExecutors=1/2/4/8/16
spark.dynamicAllocation.minExecutors=1/2/4/8/16
spark.dynamicAllocation.maxExecutors=1/2/4/8/16
spark.executor.memory=80g
spark.executor.cores=20
spark.shuffle.manager=hash
spark.shuffle.service.enabled=false
spark.executor.extraJavaOptions="-XX:+UseParallelGC -XX:+UseParallelOldGC"
We disabled the Spark external shuffle service to avoid writing intermediate shuffle data to disk, which improved performance. We also configured our underlying resource manager to run a single executor per machine. If you are using YARN, you can achieve this by setting the following parameter:
yarn.scheduler.maximum-allocation-mb=YYY
For each GraphX application, we prepared the graph by setting the number of partitions and the partitioning method:
import org.apache.spark.graphx._
val relationships = hql_query_to_read_data.
    map(row => Edge(row.getLong(0), row.getLong(1), null)).
    repartition(numExecutors * 8)
val graph = Graph.fromEdges(relationships, 0).
    partitionBy(PartitionStrategy.EdgePartition2D)
For GraphX, the times we are reporting include neither data loading nor this graph preparation. Similarly, for Giraph, we measure time from the moment the graph is loaded.
On the Giraph side, all configuration parameters are encapsulated in a special Java class that can be selectively enabled in the command line.
Performance & scalability
We wanted to evaluate the relative performance and scalability of the two systems. We started by trying to reproduce the results from the GraphX paper [5] using the same two publicly available graph data sets: the Twitter graph, which has 1.5 billion edges, and the UK web graph, which has 3.7 billion edges.
Our initial runs on the Twitter graph with the default GraphX configuration were more than 10x slower than what was reported in the paper. After careful tuning, our experiments exhibited performance closer to that observed in the paper.
In our first experiment, we ran 20 iterations of the PageRank algorithm and Connected Components algorithm on both graphs, varying the number of workers. The following figures show the running time for both systems. Note that in all the experiments, we exclude the time to load the input data in-memory, as in both systems the components that read input data are internal implementations. Here, we report only the time for the actual processing. In addition, performance on GraphX varied significantly across runs. The running times reported are the minimum we observed, not the average.
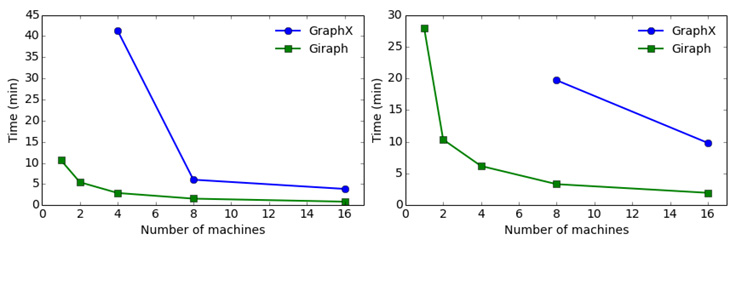
Giraph runs PageRank on the Twitter graph 4.5 times faster than GraphX with 16 workers, and four times faster with eight workers. In both systems, the running time changes as expected with respect to the number of workers (i.e., close to 1/n). But when the machines start getting low on memory, performance drops dramatically. This happens at a different number of machines for Giraph and GraphX. For instance, the PageRank running time on GraphX rises from six minutes to 41 minutes going from eight workers to four workers, while Giraph exhibits only a small increase — from 1.5 minutes to three minutes. The Giraph running time increases more sharply when we go from two machines to one, but still not that dramatically. In the case of the UK web graph, the performance difference is larger, ranging from Giraph running 5.8 times faster than GraphX with eight machines to five times faster with 16 machines. GraphX was not able to process the UK graph with four machines. The results are similar for the Connected Components algorithm.
The difference in performance is even wider if we consider efficiency in terms of the total machine time required to process a graph. GraphX requires 34 machine minutes (eight machines x 255 seconds) to find the Connected Components of the Twitter graph, while with Giraph we can process the graph in six machine minutes (two machines x 186 seconds), requiring 5.6x less machine time. On the UK web graph, Giraph requires 9x less machine time.
We also ran the more message-heavy Triangle Counting algorithm in the two systems. With Giraph, we needed 32 machines to run Triangle Counting on the UK graph, which took about 40 minutes, while GraphX could not process the UK graph with the same number of machines. Running Triangle Counting on the Twitter graph took multiple hours on Giraph and failed on GraphX, so we omit any results.
After tuning the two systems and getting GraphX to perform close to what was reported in the GraphX paper, we wanted to evaluate performance on other graphs as well. In particular, we wanted to evaluate the two systems on social graphs that do not have supernodes. For this experiment, we used Darwini [8, 9], an open source synthetic graph generator tool we developed at Facebook. We used Darwini to produce synthetic graphs [10] with properties (e.g. degree and clustering coefficient distributions) similar to those of social networks that cap the number of friends a person can have. All the synthetic graphs in these experiments were created using this tool.
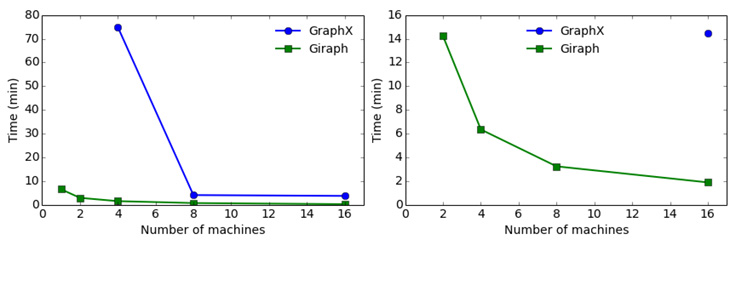
We started by generating a graph with 2 billion edges, the largest graph on which we could run all three algorithms with GraphX using 16 machines. Figure 3 shows the results.
In this experiment, Giraph was 2.8 to 3.6 times faster than GraphX on the PageRank algorithm, depending on the number of machines used. On Connected Components, Giraph was 6.2 to 6.7 times faster. Giraph also ran Triangle Counting 8.3 times faster on 16 machines. We were not able to run Triangle Counting on GraphX with fewer than 16 machines due to high memory usage. Similarly to the previous experiments, Giraph is overall more efficient, requiring from 3 to 10 times fewer machine hours than GraphX, depending on the algorithm.
Notice that on the synthetic data set, the performance gap between GraphX and Giraph is larger than on the Twitter graph even though they have a similar number of edges. We speculate that the smart partitioning mechanism of GraphX makes more of a difference for performance on the Twitter graph.
Finally, we wanted to assess how the two systems fared on more realistic workload sizes. For this, we fixed the cluster size to 16 machines and varied the graph size from 2 to 50 billion edges. In this experiment, we also used synthetically generated graphs so that we can control the parameters of the graph, such as the vertices-edges ratio and the degree distribution, as we increase the graph size. Also, as we mentioned above, we could not run Triangle Counting with GraphX on graphs with more than 2 billion edges, so we excluded this algorithm in this experiment. We show the results in Figure 4.
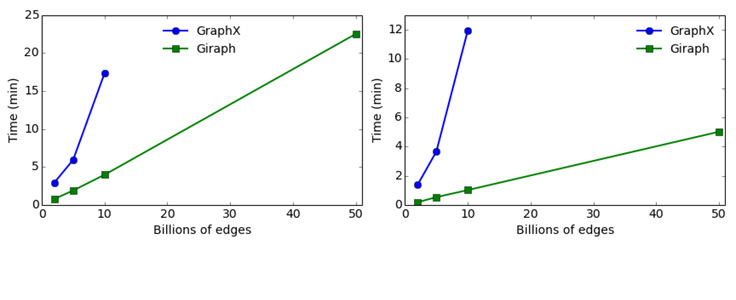
As we increased the graph size to 50 billion edges, the running time on Giraph increased linearly. GraphX could only process graphs with up to 10 billion edges on 16 machines. On a graph with 10 billion edges, Giraph can run PageRank 4.3 times faster and Connected Components 8.6 times faster than GraphX.
Sensitivity to memory configuration
Several graph applications require large aggregate memory to run. However, depending on the underlying resource management system, the required total memory may be allocated in different ways. The simplest differentiation would be choosing between a few high-memory machines or many low-memory ones. This choice may depend, for instance, on the availability of resources, whether worker machines are shared, and other factors. In our next set of experiments, we were interested in measuring how the two systems performed under different resource allocation policies.
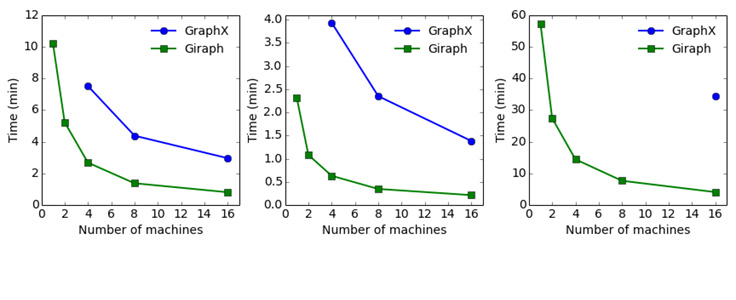
For this experiment, we used a synthetic graph with 2 billion edges. We fixed the aggregate allocated memory for the two systems and varied the number of machines a job uses. We started by allocating the maximum memory per machine (80 GB) and setting the number of machines to the smallest each system would require to run the job. For Giraph, this was one machine with an aggregate memory of 80 GB, and for GraphX it was four machines for an aggregate memory of 320 GB. Subsequently, we gradually decreased the per-machine memory and increased the number of machines, keeping the aggregate memory constant. The following figures illustrate the results.
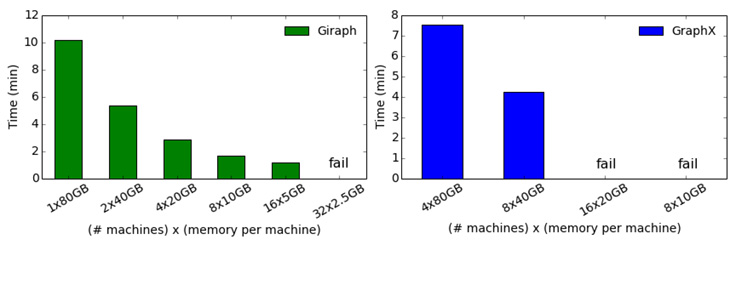
Note that, apart from our giving it 4x the memory, GraphX fails much sooner as we decrease the amount of memory per machine. For instance, if we set the per-worker memory to 20 GB for a total of 16 workers, GraphX fails even though the total memory is still 320 GB. Giraph can still operate and with a small decrease in performance even if we limit the per-worker memory to 5 GB, using 16 workers and total of 80 GB. This type of robustness to small per-worker memory allows more flexibility to scheduling and resource allocation policies.
Fault tolerance
Both systems provide mechanisms for tolerating machine failures during the execution of a job. Giraph can periodically make checkpoints of the computation state and allows the job to resume from the most recent checkpoint after a failure. However, we have found that the performance overhead of checkpointing outweighs the benefit given the low frequency of failures we experience in our production environment, so in practice we simply restart failed jobs. Spark, on the other hand, provides lineage tracking that allows the reconstruction only of the required portions of a calculation after a machine failure. In this respect, we wanted to assess what kind of advantage this gives to GraphX over Giraph in a failure scenario.
To assess the performance of the GraphX fault tolerance mechanism, we ran PageRank on the Twitter graph for 30 iterations, and killed the executor process on one of the machines after about 20 iterations. After this, the job started reconstructing the computation from the beginning. While the first few iterations were fast, subsequent iterations became exponentially slower. We saw that the amount of input and shuffle data doubled on every iteration, even though in PageRank it should be constant. However, we didn’t investigate the underlying cause. We ended up killing the job after a few hours.
Given that a job on this graph would take only a couple of minutes, we would have been much better off simply restarting the job. While it seems the reconstruction mechanism is not yet robust, more investigation is required to understand the causes.
User interface
While we focused on performance and scalability, our experience with GraphX raised a few interesting points about the programming interface and ease of development. In this respect, GraphX inherits a number of features from the Spark ecosystem that make it easy to develop graph applications. These mainly stem from the unified interface that Spark offers.
For instance, GraphX allows graphs to be read from Hive using a SQL-like query, allowing arbitrary column transformations. This makes it easy to integrate data preparation and graph preprocessing tasks in a graph application. On the other hand, Giraph does not directly support such transformations. A Giraph application typically expects a specific input schema and specific data representation. If the base table does not conform to the schema, a user has to transform it, and this is done in a separate task outside the Giraph platform. This requires extra programming effort and potentially increases the resources needed for preprocessing due to the lack of integration.
We also found that programming in Spark’s REPL environment can be useful. For instance, interacting with data in Spark to check the output of a job is convenient. It can also be useful when experimenting with small graphs, such as during the initial development and testing of an application. In such cases, it becomes handy to be able to check the output and quickly iterate over the application.The usefulness of a REPL environment only goes so far, however. As applications become more complex, a modern IDE becomes essential for the development process. For instance, the availability of javadoc and IDE features like autocomplete (the Spark shell has autocomplete, too, though not as fully featured) make it easy to discover required data types or method parameters to configure an algorithm. Even in the initial development and testing phase, when one would typically use the shell, an IDE can speed up development as the application becomes more complex.
Reproducing our study
Systems like Giraph and GraphX contain several configurable components that may affect performance. Examples include the relative number of computation and communication threads, the type of Java GC mechanism employed, buffer sizes, and more. Systems may not share the same types of parameters, and even for the common ones, the optimal value may differ, so a fair amount of tuning may be required to optimize them.
At the same time, we wanted to make it as simple as possible for others to reproduce our results by simplifying the configuration process.
In Giraph, we have made it easy to specify bulk parameter configurations. These can be statically defined as Java classes and enabled by passing an appropriate command line parameter. You can find the configuration we used at Facebook for this evaluation here. You can enable this configuration when you launch a Giraph job simply by adding to your command the option:
-Ddigraph.block_factory_configurators="org.apache.giraph.conf.FacebookConfiguration"
if your application uses the Blocks framework [6]. If your application uses the original GiraphRunner, you can call configure on FacebookConfiguration in your runner. More details on how to run a Giraph job can be found on this Quick Start guide.
The code and data we used for our evaluation are also available. On the Giraph side, these are the implementations we used for the different algorithms: PageRank, Connected Components, Triangle Counting. On the GraphX side, these are the implementations we used: PageRank, Connected Components, Triangle Counting. Finally, here are the data sets we used: Twitter graph, UK web graph, synthetic graphs [10].
Hopefully, as existing systems evolve and new systems emerge, this will help others perform comparisons like ours. For any questions on reproducing these results, please contact the Apache Giraph user mailing list.
Conclusion
Overall, we found that GraphX is not scalable or performant enough to support our production graph processing workloads. Based on a projection of the current results, we would need orders of magnitude more machines to support our existing production workloads. Aside from this, even for the graph sizes that GraphX can handle, there is a large gap in efficiency in terms of machine hours required, and its performance was not stable. However, the GraphX programming interface offers a number of features that simplify application development, such as SQL integration. These are features that we would like to add to Giraph in the future.
References
[1] One Trillion Edges: Graph Processing at Facebook Scale, 41st International Conference on Very Large Data Bases (VLDB ’15), August 2015
[2] Recommending items to more than a billion people, Facebook blog post, June 2015
[3] Social Hash: An Assignment Framework for Optimizing Distributed Systems Operations on Social Networks, 13th USENIX Symposium on Networked Systems Design and Implementation (NSDI ’16), March 2016
[4] Compressing Graphs and Indexes with Recursive Graph Bisection, 22nd ACM SIGKDD Conference on Knowledge Discovery and Data Mining (KDD ’16), August 2016
[5] GraphX: Graph Processing in a Distributed Dataflow Framework, 11th USENIX Symposium on Operating Systems Design and Implementation (OSDI ’14), October 2014
[6] The Giraph Blocks Framework
[7] Scaling Apache Giraph to a trillion edges, Facebook blog post, August 2013
[8] Darwini: Generating realistic large-scale social graphs, arXiv:1610.00664 [cs.SI]
[9] Darwini open source implementation
[11] Apache Spark @Scale: A 60 TB+ production use case, Facebook blog post, August 2016


