The rise of Android phone usage around the world in the past few years has been staggering. Facebook now sees more than half a billion people connect each month from more than 10,000 different Android device models. As we’ve restructured mobile development to be owned by each individual product team within the company, we have kept small groups of people focused on developing a deeper understanding of each platform in order to provide common tools and knowledge so we can avoid re-inventing the wheel.
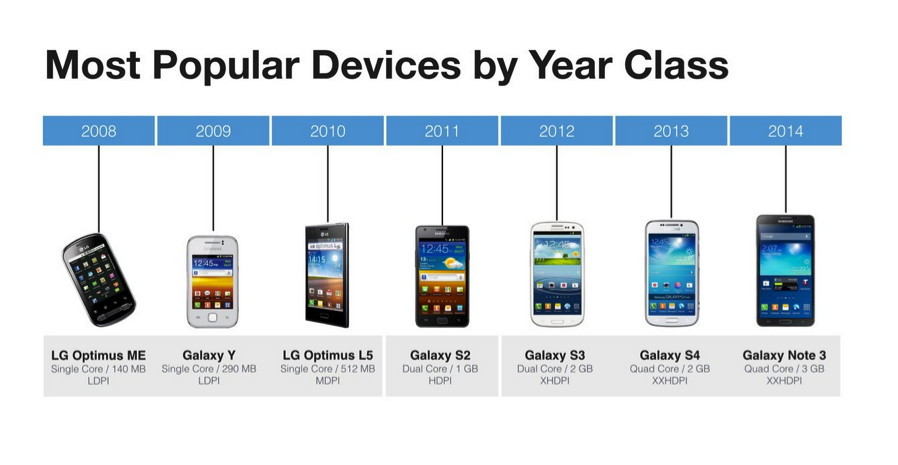
With so many different types of phones in the world, being able to segment people and their devices to understand usage patterns and performance is a significant task. Historically we relied on cuts by Android OS version, looking at how Gingerbread behaved differently from Ice Cream Sandwich, how Ice Cream Sandwich behaved differently from Jelly Bean, and so on. However, the recent explosion of affordable Android devices around the world has shifted the median, and the bulk of devices we now see are running Jelly Bean. In order to segment based on actual phone performance we decided to look more closely into the specifications of the phone – RAM, CPU cores, and clock speed – to characterize things. Using these three specifications, we’ve clustered every phone into a group of similarly capable devices to make understanding performance easier.
We call this new concept “year class” – essentially, in what year would a given device have been considered “high end?” This allows teams around the company to segment the breadth of Android devices into a more understandable set of buckets, and as new phones are released, they’re automatically mapped into the representative year. For example, the Alcatel T-Pop I bought at a market in Mexico is immediately recognized as a 2010-class phone, despite its 2012 release. Overall, about two-thirds of the phones connected to Facebook are equivalent to something released in 2011 or earlier.
Year class allows teams to think about a handful of segments of the Android population, rather than every individual device. Using year class in conjunction with screen resolution, we can break down metrics to make decisions about why behavior shifts on different devices – is it performance, screen real estate, or something else? While the Android OS version is still useful for reliability and crash benchmarks, we’ve found year class to give us a much more accurate portrayal of how performance and behavior can vary between different devices.
In addition to analyzing data by year class, we are using it to roll out new product features. Using year class we shipped a better commenting UI to 2012 year class or better phones high-end devices while we worked to optimize it on older models. We also use it to power News Feed ranking, so that we don’t show as many video stories to phones that can’t play them smoothly, and prioritize showing you things that work best on your phone. Going forward, year class can help determine many other logic decisions around animation, how much content to load, and other elements of the apps performance.
With the success of year class in helping teams understand the breadth of Android, we’ve started investigating adding clusters for other important device characteristics into our internal tools. Just like not all phones are made equal, not all 3G networks are equal. Looking at the network latency between devices and our servers, as well as the transfer rate for sufficiently large images, our Android app computes its own “connection quality” score ranging from poor to moderate to good to and excellent. Then, regardless of whether a connection says it is 2G, 3G, or Wi-Fi, we can adjust features like video autoplay and photo quality to make the app more performant in these circumstances. Our initial findings are showing that Wi-Fi and 3G networks in areas with less developed infrastructure or more crowded networks are often 2-4 times slower on average than what we experience in developed markets, so we’re making sure the app can scale all the way down to a congested EDGE connection gracefully. We’ve already made initial improvements in our image encoding efficiency here by tuning quality parameters, but are just scratching the surface.
To learn more about year class and our efforts in connection quality check out this video from our @Scale 2014 talk.