
As an intern on the database engineering team, I spent last summer analyzing Facebook’s database workload and helping develop a new benchmark called LinkBench. We’re proud to release LinkBench this week on GitHub, and hope it will be a useful tool for other developers who need to benchmark and tune database systems.
The Facebook social graph and MySQL
MySQL, which is used to store data like posts, comments, likes, and pages, has been used at Facebook since its early days, and is an important component of our infrastructure.
One way we represent this data is as a social graph, where objects (graph nodes) such as people, posts, comments, and pages are connected by associations (directed edges of the graph) that model different relationships between the nodes. Different types of associations can represent friendship between two users, a user liking another object, ownership of a post, etc.

Why another database benchmark?
Over the last five to ten years there has been a flurry of innovation in database systems, as NoSQL and NewSQL solutions have become serious competitors to relational databases. The hardware landscape is also changing rapidly. Solid-state storage and multi-core CPUs are becoming mainstream and offer the potential for significant database performance gains. We can already exploit solid state storage with MySQL using FlashCache, but there is plenty of scope for solid-state optimized database systems to more fully exploit the hardware.
What does all this change mean for Facebook? First, it means that we have many opportunities to improve the efficiency of our production database infrastructure, reducing energy usage and hardware costs while improving responsiveness. Second, it means that we need systematic ways to evaluate the suitability and performance of new database systems for Facebook’s production workloads.
MySQL offers a good mix of flexibility, performance, and administrative ease, but the database engineering team continues to explore alternatives to MySQL for storing social graph data. There are several generic open-source benchmarks that could provide a starting point for comparing database systems. However, the gold standard for database benchmarking is to test the performance of a system on the real production workload, since synthetic benchmarks often don’t exercise systems in the same way. When making decisions about a significant component of Facebook’s infrastructure, we need to understand how a database system will really perform in Facebook’s production workload.
We also believe that the broader community working on databases and social applications can benefit from a realistic benchmark for storage and retrieval of social network and other graph-structured data. These applications place many unique demands on database infrastructure due to rapid growth, large volumes of data, and rich data models, yet there are few benchmarks that test performance for these workloads.
LinkBench addresses these needs by replicating the data model, graph structure, and request mix of our MySQL social graph workload. LinkBench is a graph-serving benchmark, not a graph-processing benchmark–the difference being that the former simulates the transactional workload from an interactive social network service while the latter simulates an analytics workload. This benchmark is not about finding graph communities or graph partitioning, but rather serving real-time queries and updates on a graph database. For example, a general form of graph query would be to find all the edges of type A from node X into which update operations can insert, delete, or update graph nodes or edges. An example graph update operation is “insert a friendship edge from user 4 to user 63459821.”
Understanding Facebook’s social graph workload
Much of my internship was spent analyzing the social graph data and database query workload to extract key parameters that could be used to model the workload for LinkBench.
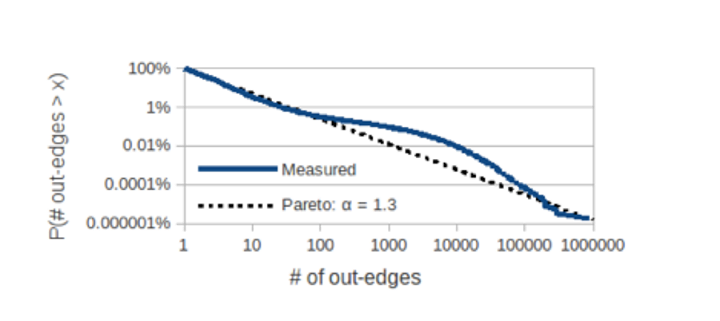
One particularly important property that we replicate in LinkBench is the out-degree distribution controlling how many out-edges each node in the graph has. It has been well documented in the past that many networks, such as human friendships or links between web pages, tend to follow power-law distributions, and this also holds for the social graph, which includes a variety of node types. This is shown in the chart below:
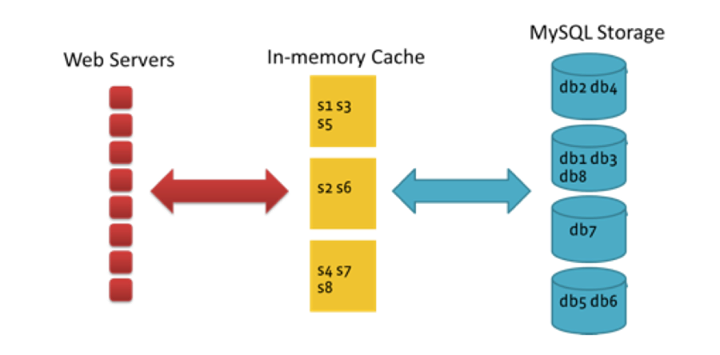
LinkBench also needs to emulate the database queries that hit the MySQL production database. The majority of data required for the Facebook website and mobile apps is served from in-memory caches, with all writes and a small fraction of cache-miss reads going to MySQL. Our workload is heavily read-dominated, so the read misses outnumber writes, despite a high hit rate in the cache.
By classifying database queries into a small number of core operations for associations (edges) and objects (nodes), we could break down and analyze the mix of social graph operations for a production database. The simple graph retrieval and update operations listed below are used to store and retrieve social graph data.
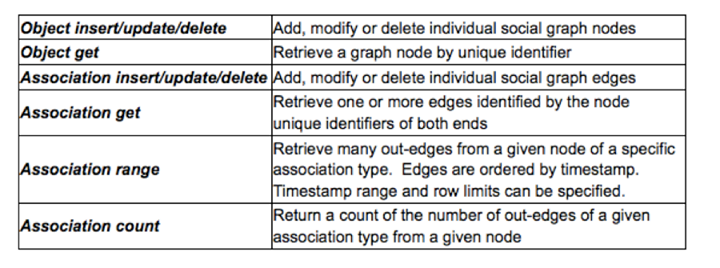
The graphs below show the mix and variation of these operations over time on a production database instance. Note that the workload is heavy on edge operations and reads, particularly edge range scans. Examples of edge range scans are “retrieve all comments for a post order from most to least recent” or “retrieve all friends for a user.”
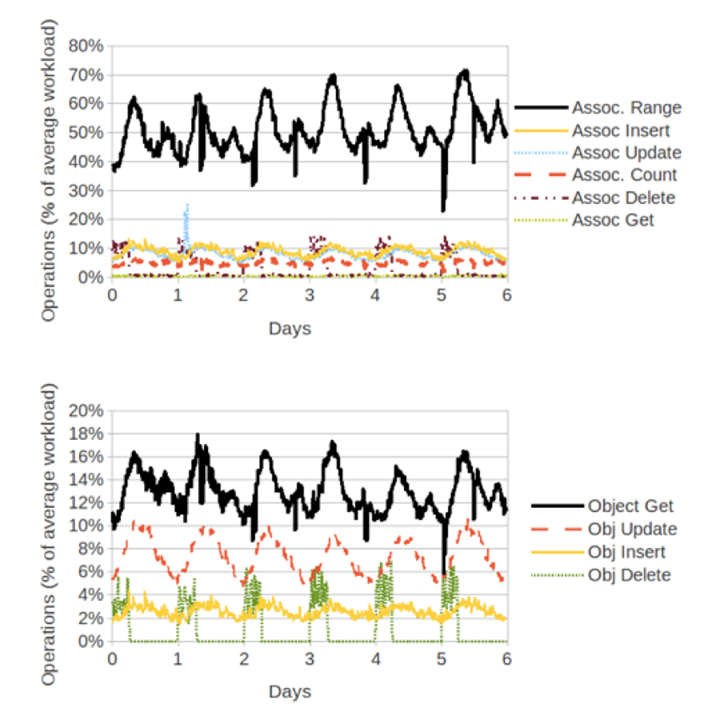
Mix and variation over time for social graph operations on a production MySQL instance. The percentages are relative to the average operations/sec for the instance.
Additional analysis of access patterns for these different operations using workload traces uncovered some more interesting properties:
- -Read and write access patterns to nodes and edges also follow a power-law distribution, with some hot or warm database rows and many cold database rows. This is typical for database workloads, but we were unsure how Facebook’s use of in-memory caches, such as memcached, would affect access patterns.
- -The structure of the graph plays a role in access patterns: edges connected to high-degree nodes are more frequently read and written than edges of low-degree nodes.
- -I was able to derive parameters from the traces that approximately quantify these effects so they can be recreated in LinkBench.
LinkBench architecture
LinkBench is designed to be customizable and extensible. This allows us to simulate the load generated by subsets of the social graph, which is important when evaluating database configurations tailored to specific association types. For example, it might be useful to store write-heavy types in a different backend than read-heavy types, so we can evaluate performance separately for those cases. It also allows us to implement adapters for new database systems with relative ease so we can see how they stack up against MySQL on our production workload.
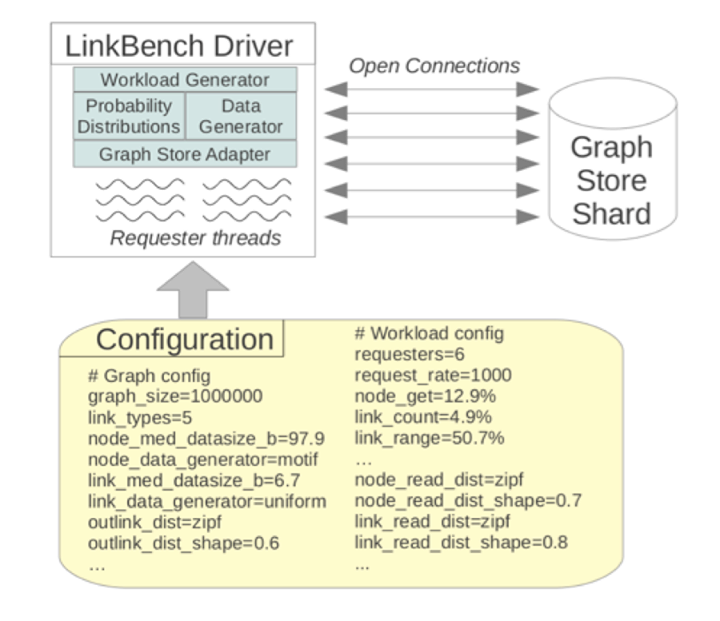
The actual benchmark is driven by the LinkBench driver, a Java program that generates the social graph and the operation mix. The benchmark runs in two phases: a load phase, where an initial graph is generated and loaded in bulk, and the request phase, where many request threads concurrently access the database with a mix of operations. During the request phase latency and throughput statistics for operations are collected and reported.
The exact behavior of the driver in both phases is controlled by a configuration file, and many aspects of the benchmark can be altered simply through this file.
Benchmark Results
We did some MySQL benchmark runs using MySQL 5.1.53 plus the Facebook patch (see http://www.facebook.com/MySQLatFacebook). We generated a database with 1.2 billion nodes and 4.9 billion edges, which occupies around 1.4TB on disk with MySQL’s standard uncompressed InnoDB tables. The MySQL host had 2 CPU sockets, 8+ cores/socket, 144GB of RAM, and solid-state storage with read latency at 16kB less than 500μs.
We did a series of benchmark runs under different levels of load. To test the maximum throughput of the MySQL server, we did a run with 100 request threads, each issuing requests to MySQL as fast as possible. We obtained a sustained throughput of 11029 requests per second. Request latencies from this run, shown below, indicate that the system remains responsive under heavy load. Even when the MySQL server is fully loaded in the throughput benchmark, median latencies remain low. LinkBench can throttle requests to simulate typical production scenarios where servers are not under continuous full load, in which case latencies tend to be even lower.
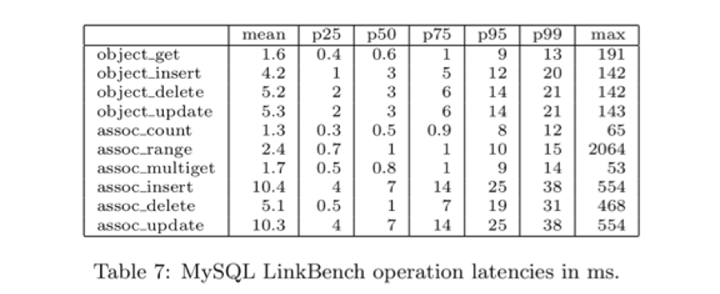
MySQL LinkBench operations latencies in ms. Latency is measured from the time the LinkBench driver calls the Graph Store adapter until the time it returns.
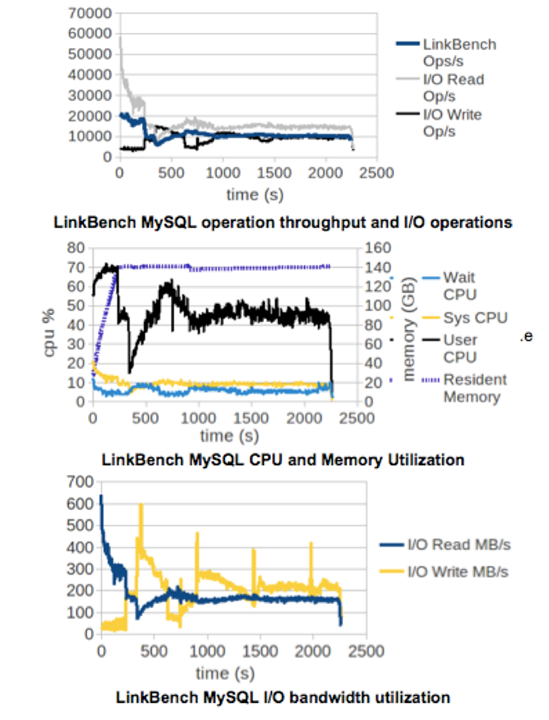
We also collected traces of system resource utilization to better understand the behavior of the server.
Measuring operation throughput and I/O usage over time show us that the server takes some time to warm up and reach a steady state. As the MySQL server warms up, two competing effects cause operation throughput to fluctuate up and down. The database buffer pool starts off empty, so fewer operations can be satisfied with cached data. As the system warms up, the buffer pool fills up with pages from disk, so most reads don’t require an I/O operation and finish quickly. However, as time proceeds, more pages in the buffer pool are dirty–i.e., they have data that has not been flushed to disk – which forces more frequent writes to disk as dirty pages are evicted.
CPU usage statistics indicate that MySQL server performance is not compute-bound on this workload, since user CPU usage is around 50%. The high I/O utilization achieved, measured in either operations/second or MB/s, shows that that the MySQL server is able to exploit the additional I/O capacity of the solid-state storage on the machine.
Getting LinkBench
To get LinkBench, and for more information about using LinkBench and customizing it for your own needs, check out our GitHub page: http://github.com/facebook/linkbench.
Thanks to Dhruba Borthakur, my intern mentor at Facebook, and the rest of the database engineering team for their help and support during my internship.
Tim Armstrong is a PhD candidate in Computer Science at the University of Chicago.


