At Facebook we’re continuously pushing the boundaries of 360 technology. We’ve pioneered ideas such as offset cubemaps, dynamic streaming, and content-dependent streaming. With every new technology, it’s important to be able to assess the quality of the immersive experience compared with previous approaches in terms of things like resolution, bitrate, or structural similarity. A reliable quality assessment (QA) workflow can provide consistent criteria for comparing 360 view sessions and help us make data-driven decisions about whether to adopt a new 360 technology into our ecosystem.
Unfortunately, there isn’t a broadly accepted QA standard for 360 content, and the established QA workflows for conventional, non-360 media don’t capture the relevant properties of a 360 video — immersiveness and viewer control. Each frame in a 360 video encompasses an omnidirectional, spherical scene that needs to be warped into a rectangular frame at the encoding level. This warping affects conventional frame-by-frame image QA and makes the outcome unreliable. In addition, viewers can decide which direction to look at every time instance during 360 video playback. This means that the final view quality is determined by the quality of the partial frame within the viewer’s field of view rather than the overall spherical frame.
We developed a new QA workflow for 360 video streaming that addresses the warping and field-of-view problems and introduces two new standards: SSIM360 and 360QVM. These standards provide quantified metrics on the quality of individual encoding and playback components and on the overall quality of a streaming session, respectively. This allows us to understand the performance of each component in our 360 pipeline and track the gains in encoding efficiency and playback quality as we introduce new features. We’re sharing our QA workflow that we hope will enable the broader 360 developer community to quantify and share their developments in creating more immersive experiences.
Encoding quality assessment
A brief intro to conventional non-360 SSIM
The Structural Similarity Index, or SSIM, is a well-accepted QA metric that is used broadly for evaluating image and video encodings. Full-reference QA takes two input images — a reference image (e.g., the original content), and an altered image (e.g., the encoded content) — and outputs a score between zero and one. This score represents the structural similarity of the two images: a score of 1 means the images are identical and thus the quality is well-preserved; 0 means the two are totally different, implying serious structural deformation. When SSIM is used for video QA, the assessment is done frame by frame, and works only if the length and frame rates of the two input videos are exactly the same.
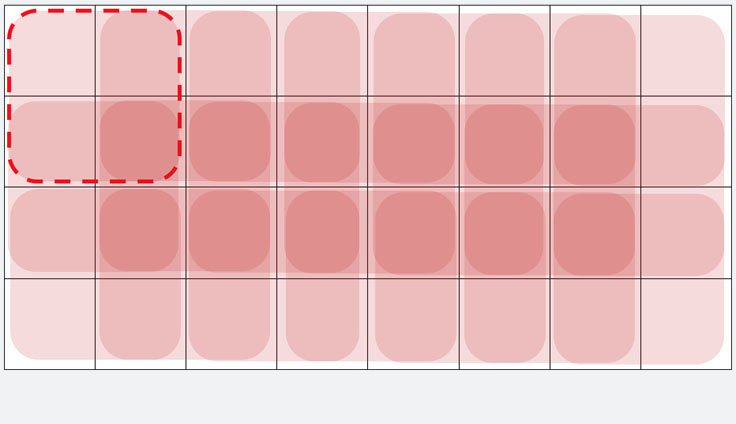
Like most image processing algorithms, SSIM does not measure the entire image at once. Instead, it samples a smaller region from both input images (similar to macro blocks in image compression) and compares the samples. In the original paper, the authors propose an 11×11 Gaussian kernel to be used in this sampling, while ffmpeg’s vf_ssim filter uses a uniform 8×8 block (as illustrated above). We get one SSIM value from each sample. To get the SSIM of each image, we average these per-sample SSIMs. To get the SSIM of the whole video, we further average the per-image SSIMs of all the frames.
Warping problem
The sampling regions in SSIM are static (i.e., same size, same shape) and have identical weight in the final averaging. For example, in the ffmpeg implementation above, every 8×8 region in the image is equally influential to the final SSIM score, regardless of its location in the image. This is not true for 360 media.
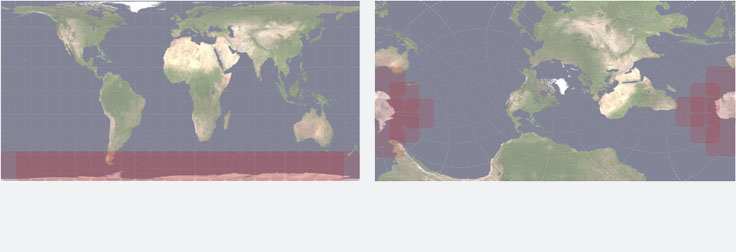
Consider the two world maps below. The one on the left is encoded with a codec that degrades quality in the lower part of the frame (Antarctica); and the right one is simply a reoriented version of the encoded map on the left. When rendered into 3D spheres, the two maps should look exactly that same (except for the orientation), so the scores they would get from a reliable QA for 360 content should also be the same. However, if we use SSIM as our QA standard, the map on the left will have a lower score. This is because the “bad quality” part (Antarctica) of the right map takes up a smaller proportion of the map due to less warping closer to the vertical center in an equirectangular representation. With an 8×8 sampling block of SSIM (presented as red blocks overlaid on the two maps), the area taken up by Antarctica in the left map is sampled 23 times, versus only 12 times on the right, which incurs different average SSIM scores. This shows that the non-360 SSIM process is unreliable because it outputs different values for the same 360 content.
Snapshots
One way to prevent the effects of warping would be to sample directly from the rendered views in the 360 sphere instead of the equirectangular representation. We would take an infinite number of square snapshots from all possible view directions in a 360 sphere. These samples would be flat images, weighted equally, so the warping problem would be gone and SSIM would be a valid QA.
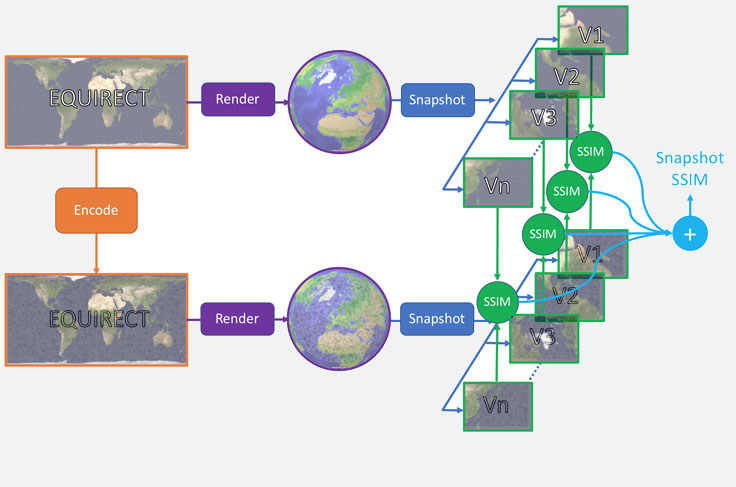
Although reliable, the computational complexity of this method makes it an unfeasible QA solution for 360 images. It’s not trivial to take a single snapshot from a given view with our Transform360 library, let alone take an infinite number and run SSIM on them individually. However, we can use the aggregated snapshot score as a ground truth for validating our new SSIM360 standard.
SSIM360
Another approach to solving the warping problem is to put a weight on each per-sample SSIM score when they are averaged together. The weight is determined by how much the sampled area is stretched in the representation: the more stretching, the smaller the weight. This can be calculated by “the proportion of a rendered sphere that the sample covers” over “the proportion of a frame that the sample covers.” Each sample contributes differently to the final score, effectively canceling out the warping effect. This weighted-average version of the original SSIM is called SSIM360.
To verify the outcome of SSIM360, we compare it against Snapshot SSIM, our ground truth. We ran the verification experiment on different 360 videos of various textural and motional characteristics, and on different codecs, scaling, and quality preservation targets. These degraded test cases are then evaluated by 1) SSIM, 2) SSIM360, and 3) Snapshot SSIM.
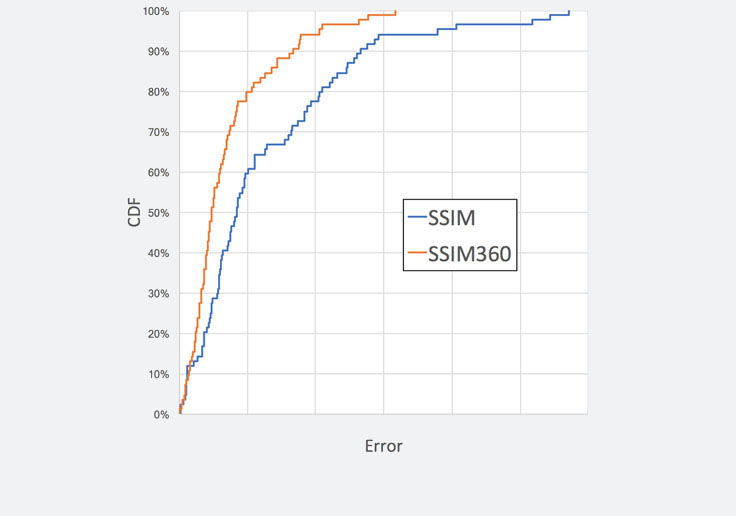
In the plot above we see the cumulative distribution function (CDF) of SSIM360 and SSIM. In almost all percentiles, SSIM360 outperforms SSIM by cutting the error in half. The error is defined as the absolute difference between the ground truth score (Snapshot SSIM) and the output score from each QA (SSIM360, SSIM). Computationally, since SSIM360 is only replacing the uniform weighting in per-sample SSIM aggregation with pre-computable weight maps, SSIM360 is as efficient as conventional SSIM.
Playback quality assessment
Field-of-view problem
SSIM360 assesses quality at the encoding level with no knowledge of where the viewer will be looking. In the playback quality assessment, however, we have to take the view direction into account. At any given time, only about 15% of the 360 scene will reside in viewer’s field-of-view (FOV). This means the overall quality of the whole spherical frame, calculated with SSIM360, is not representative anymore. This is especially true when we adopt view-dependent optimizations in our content delivery framework. View-dependent optimization techniques like offset projections, saliency-based encoding, and content-dependent streaming are essentially biasing bit allocation (equivalent to pixel allocation in most cases) toward perceptually more important regions in a video. They do not enhance the quality of the frame as a whole but instead optimize the parts where viewers are most likely to look.
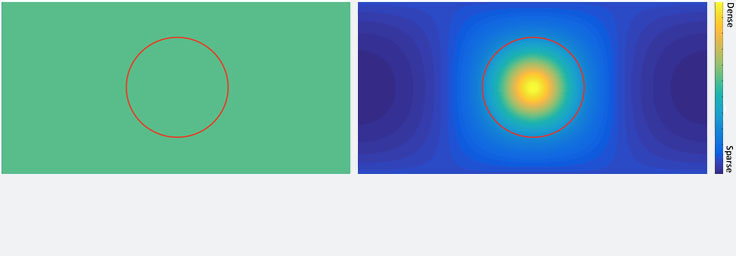
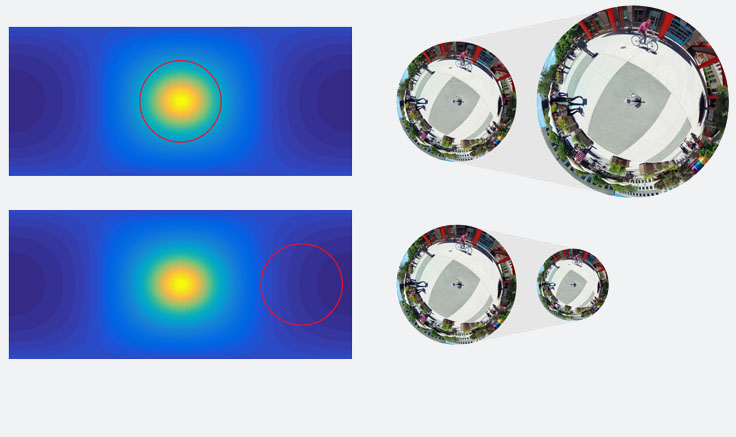
The right image above shows the pixel density map of an offset projection, which assumes higher perceptual importance in the center. Compared to the projection without a view-dependent optimization on the left, the quality (implied by pixel count) within the focused region (red circle) is much higher. SSIM360 cannot capture this kind of improvement because it focuses on the entire frame and the overall pixel counts on both sides in this example are in fact the same.
From view to pixel density to quality scaling
We solve the FOV problem through two mappings: one from the view direction to pixel density, and another from pixel density to a scaling factor applied to the SSIM360 score. The first mapping considers the projection used in the encoding and the view direction and FOV during playback, and asks how many pixels reside in the FOV at every time instance. In other words, how many pixels are in the red circle? With the pixel density map known, the answer can be computed efficiently through closed-formed geometry formulae.
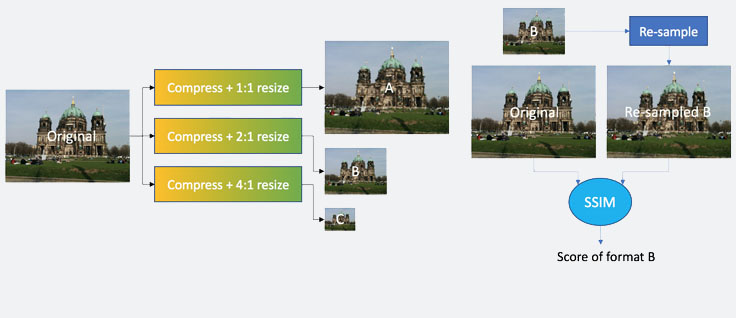
The second mapping adjusts the quality score of SSIM360 by introducing a scaling factor that reflects the change in pixel density. In non-360 QA, a similar technique is used to evaluate quality degradation resulting from downsizing (i.e., ‘shrinking’ an image to a smaller width/height). Since SSIM assumes that the reference and altered images have equal dimensions, a downsized image must be scaled back up to the original size and resampled to assess quality degradation. The computing effort required to do this is not negligible, especially when we want to evaluate a transcoding process, which produces tens of encoded formats with various dimensions, all of which need to be resampled in separate QA processes, as illustrated below.
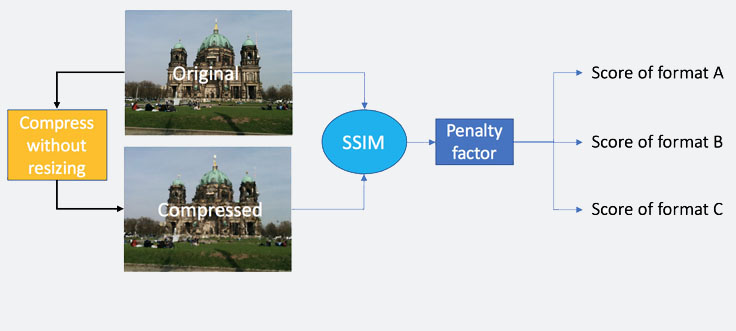
We can avoid this computational overhead by decoupling the QA of the transcoding process into two steps: QA of compression, and QA of resizing. As shown below, SSIM is carried out on the compressed version without resizing. The individual quality score of each resized format is then approximated by applying a penalty factor to the score of the compressed version. The ratio of resizing is one factor in determining the penalty: the smaller the resized version is, the more structural detail it loses, and the higher the penalty factor. Replacing resampling with the determination of a penalty is much more efficient and reduces the number of times we run SSIM.
In 360 video, the change in resolution doesn’t come from resizing but from the change in pixel density within the FOV. As the view direction moves toward a region with higher/lower pixel density, the resolution of the viewed content (i.e., content within FOV) increases/decreases. The scaling factor then is different from the penalty factor in the sense that it could either decrease or increase the SSIM360 score.
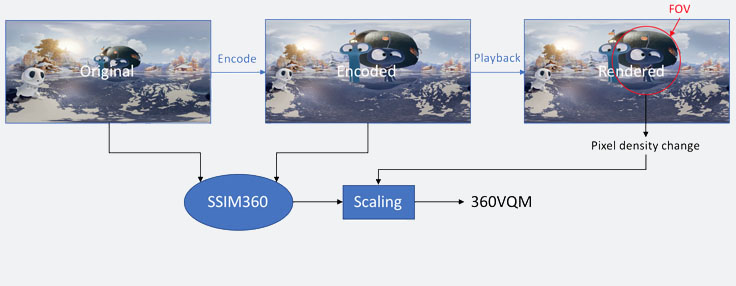
360VQM
By adopting the these techniques into our customized QA workflow, we solve the warping and the FOV problems in 360 video view session QA. The SSIM360 replaces SSIM to deal with warping in encoding and the penalty factor is replaced by the new scaling factor derived from pixel density change due to view change. The outcome of this QA workflow is called 360VQM: 360 video quality metric. It accurately and efficiently captures the quality change in the encoding process, and imposes the effect of resolution change during playback onto the final score to account for view-dependent optimizations.
Summary
As 360 media continues to grow and encompasses photo, video, and VR experiences, a standardized QA workflow on how we process and present immersive content becomes more crucial. SSIM360 and 360VQM are two new QA standards we developed at Facebook to help us verify the performance of our 360 video pipeline on encoding and streaming. Both standards have been fully adopted into our ecosystem and provide reliable quantified metrics to help us improve immersive experiences on Facebook. We are excited to share this development and hope our efforts will help shape an industry-wide QA standard tailored for immersive content.